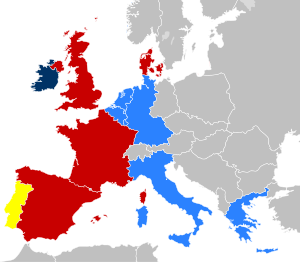
European Parliament election, 1989
|
|
|||||||||||||||||||||||||||||||||
|---|---|---|---|---|---|---|---|---|---|---|---|---|---|---|---|---|---|---|---|---|---|---|---|---|---|---|---|---|---|---|---|---|---|
|
|||||||||||||||||||||||||||||||||
|
|
|||||||||||||||||||||||||||||||||
|
All 518 seats to the European Parliament 260 seats needed for a majority |
|||||||||||||||||||||||||||||||||
| Turnout | 58.5% | ||||||||||||||||||||||||||||||||
|
|||||||||||||||||||||||||||||||||

* The number of seats was increased from 434 to 518 – so this is a nominal figure
|
|||||||||||||||||||||||||||||||||
|
|||||||||||||||||||||||||||||||||
The 1989 European Parliamentary Election was a European election held across the 12 European Community member states in June 1989. It was third European election but the first time that Spain and Portugal voted at the same time as the other members (they joined in 1986). Overall turnout dropped to 59%
The Socialists held their third consecutive victory, rising to 180 seats (166 pre-election), with the People's Party managing to win only 8 extra seats. However, the European Democrats had a massive loss of 32 of the 66 seats, knocking them from third to sixth largest party. The liberals, who had already risen one place with the byelections in Spain and Portugal earlier, gained an extra seat, holding their new-found third place with both the Rainbow and Communist groups splitting post-election.
These were the first elections Portugal and Spain took part in with the other states. Spain was allocated 60 seats and Portugal was allocated 24; the number of seats for the other states remained the same, raising the total number of seats from 434 to 518.
...
Wikipedia


