Niagara Falls (electoral district)
|
|
|||
|---|---|---|---|

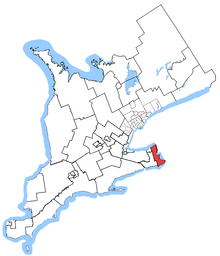
Niagara Falls in relation to southern Ontario ridings
|
|||
| Federal electoral district | |||
| Legislature | House of Commons | ||
| MP |
Conservative |
||
| District created | 1952 | ||
| First contested | 1953 | ||
| Last contested | 2015 | ||
| District webpage | profile, map | ||
| Demographics | |||
| Population (2011) | 128,357 | ||
| Electors (2015) | 101,505 | ||
| Area (km²) | 579 | ||
| Pop. density (per km²) | 221.7 | ||
| Census divisions | Niagara | ||
| Census subdivisions | Niagara Falls, Fort Erie, Niagara-on-the-Lake | ||
Niagara Falls is a federal electoral district in Ontario, Canada, that has been represented in the House of Commons of Canada since 1953.
It consists of the city of Niagara Falls and the towns of Niagara-on-the-Lake and Fort Erie.
The riding was created in 1952 from parts of Erie—Lincoln and Welland ridings. It consisted initially of the townships of Stamford, Willoughby and Bertie, the city of Niagara Falls, and the towns of Fort Erie, Chippawa and Crystal Beach in the county of Welland. In 1966, the towns of Fort Erie, Chippawa and Crystal Beach and the township of Stamford were excluded from the riding.
In 1976, the riding was redefined to consist of the City of Niagara Falls and the Town of Niagara-on-the-Lake. In 1996, the riding was expanded to include the part of the City of Thorold lying east of the Welland Canal. In 2004 the western boundary of the riding was moved east from the Welland Canal to the Thorold town line, while the southern boundary was extended south to Lake Erie. This change excluded the town of Thorold and included all of the town of Fort Erie.
This riding was left unchanged during the 2012 electoral redistribution.
Ethnic groups: 89.5% White, 2.4% Aboriginal, 1.9% Black, 1.3% Chinese, 1.2% Filipino, 1.0% South Asian
Languages: 82.3% English, 3.8% Italian, 2.4% French, 1.9% German, 1.1% Chinese, 1.0% Spanish
Religions: 74.2% Christian (35.5% Catholic, 9.2% Anglican, 7.3% United Church, 3.4% Presbyterian, 2.2% Lutheran, 1.8% Christian Orthodox, 1.6% Pentecostal, 1.6% Baptist, 11.7% Other Christian), 1.1% Muslim, 23.2% None.
Median income: $27,796 (2010)
Average income: $35,758 (2010)
...
Wikipedia
