1985 Pacific typhoon season
| 1985 Pacific typhoon season |

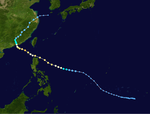
Season summary map
|
| Seasonal boundaries |
| First system formed |
January 4, 1985 |
| Last system dissipated |
December 23, 1985 |
| Strongest storm |
|
| Name |
Dot |
| • Maximum winds |
220 km/h (140 mph)
(10-minute sustained) |
| • Lowest pressure |
895 hPa (mbar) |
| Seasonal statistics |
| Total depressions |
57 |
| Total storms |
28 |
| Typhoons |
15 |
| Super typhoons |
1 |
| Total fatalities |
1,355 |
| Total damage |
> $243.1 million (1985 USD) |
| Related articles |
|
|
Pacific typhoon seasons
1983 1984 1985 1986 1987
|
| Severe tropical storm (JMA) |
| Tropical storm (SSHWS) |
|
|
| Duration |
January 4 – January 13 |
| Peak intensity |
95 km/h (60 mph) (10-min) 990 hPa (mbar) |
| Tropical storm (JMA) |
| Tropical storm (SSHWS) |
|
|
| Duration |
January 7 – January 11 |
| Peak intensity |
65 km/h (40 mph) (10-min) 1000 hPa (mbar) |
| Tropical depression (JMA) |
|
|
| Duration |
April 21 – April 26 |
| Peak intensity |
55 km/h (35 mph) (10-min) 1000 hPa (mbar) |
| Typhoon (JMA) |
| Category 3 typhoon (SSHWS) |
|
|
| Duration |
May 20 – May 26 |
| Peak intensity |
150 km/h (90 mph) (10-min) 950 hPa (mbar) |
| Tropical storm (JMA) |
| Tropical depression (SSHWS) |
|
|
| Duration |
June 14 – June 22 |
| Peak intensity |
65 km/h (40 mph) (10-min) 990 hPa (mbar) |
| Typhoon (JMA) |
| Category 3 typhoon (SSHWS) |
|
|
| Duration |
June 19 – June 27 |
| Peak intensity |
150 km/h (90 mph) (10-min) 960 hPa (mbar) |
| Typhoon (JMA) |
| Category 2 typhoon (SSHWS) |
|
|
| Duration |
June 24 – July 1 |
| Peak intensity |
150 km/h (90 mph) (10-min) 955 hPa (mbar) |
| Tropical depression (JMA) |
| Tropical storm (SSHWS) |
|
|
| Duration |
July 4 – July 8 |
| Peak intensity |
55 km/h (35 mph) (10-min) 998 hPa (mbar) |
| Typhoon (JMA) |
| Category 1 typhoon (SSHWS) |
|
|
| Duration |
July 21 – August 2 |
| Peak intensity |
130 km/h (80 mph) (10-min) 965 hPa (mbar) |
The 1985 Pacific typhoon season has no official bounds; it ran year-round in 1985, but most tropical cyclones tend to form in the northwestern Pacific Ocean between May and November. These dates conventionally delimit the period of each year when most tropical cyclones form in the northwestern Pacific Ocean. Tropical Storms formed in the entire west pacific basin were assigned a name by the Joint Typhoon Warning Center. Tropical depressions that enter or form in the Philippine area of responsibility are assigned a name by the Philippine Atmospheric, Geophysical and Astronomical Services Administration or PAGASA. This can often result in the same storm having two names.
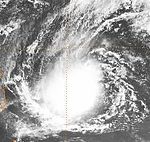
A total of 29 tropical depressions formed this year in the Western Pacific, of which 28 became tropical storms. 17 storms reached typhoon intensity, of which one typhoon reached super typhoon strength. The strongest cyclone of the season, Dot, reached category 5 on the Saffir-Simpson scale to the east of the Philippines. Typhoon Cecil was the deadliest storm of the season, accounting for nearly half of the deaths from western Pacific tropical cyclones in 1985.
A total of 29 tropical depressions formed this year in the Western Pacific, of which 28 became tropical storms. 17 storms reached typhoon intensity, of which 1 reached super typhoon strength. Only four tropical cyclones moved through the Philippines this season, while eight moved into China, three moved into Vietnam, and three moved into Japan. Tropical cyclones brought Hong Kong 40 percent of its annual rainfall. The strongest cyclone of the season, Dot, reached category 5 on the Saffir-Simpson scale. However, it weakened slightly before moving into the Philippines at the high end of category 3 status. Typhoon Cecil was the deadliest storm of the season, accounting for nearly half of the deaths from western Pacific tropical cyclones in 1985.
The initial tropical disturbance formed on the west end of the near-equatorial, or monsoon, trough. Due to strong high pressure due its north, and the associated high winds associated with the northern Asian monsoon, strongest winds within the system were on its western periphery. Strong southerly winds aloft led to persistent vertical wind shear, which limited its intensification is it moved west to northwest. It passed nearby Yap, and caused crop damage as it passed by the island group.
...
Wikipedia


