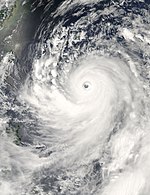
2007 Pacific typhoon season
| 2007 Pacific typhoon season |

Season summary map
|
| Seasonal boundaries |
| First system formed |
January 5, 2007 |
| Last system dissipated |
November 29, 2007 |
| Strongest storm |
|
| Name |
Sepat |
| • Maximum winds |
205 km/h (125 mph) |
| • Lowest pressure |
910 hPa (mbar) |
| Seasonal statistics |
| Total depressions |
34 |
| Total storms |
24 |
| Typhoons |
14 |
| Super typhoons |
8 (unofficial) |
| Total fatalities |
320 |
| Total damage |
$7.5 billion (2007 USD) |
| Related articles |
|
|
Pacific typhoon seasons
2005, 2006, 2007, 2008, 2009
|
| Typhoon (JMA) |
| Category 3 typhoon (SSHWS) |
|
|
| Duration |
March 30 – April 6 |
| Peak intensity |
150 km/h (90 mph) (10-min) 960 hPa (mbar) |
| Typhoon (JMA) |
| Category 4 super typhoon (SSHWS) |
|
|
| Duration |
May 17 – May 23 |
| Peak intensity |
175 km/h (110 mph) (10-min) 935 hPa (mbar) |
| Tropical storm (JMA) |
| Tropical storm (SSHWS) |
|
|
| Duration |
July 4 – July 5 |
| Peak intensity |
65 km/h (40 mph) (10-min) 994 hPa (mbar) |
| Typhoon (JMA) |
| Category 4 super typhoon (SSHWS) |
|
|
| Duration |
July 9 – July 16 |
| Peak intensity |
185 km/h (115 mph) (10-min) 930 hPa (mbar) |
| Typhoon (JMA) |
| Category 4 super typhoon (SSHWS) |
|
|
| Duration |
July 27 – August 4 |
| Peak intensity |
165 km/h (105 mph) (10-min) 945 hPa (mbar) |
| Tropical depression (JMA) |
| Tropical depression (SSHWS) |
|
|
| Duration |
August 2 – August 6 |
| Peak intensity |
55 km/h (35 mph) (10-min) 1000 hPa (mbar) |
| Typhoon (JMA) |
| Category 1 typhoon (SSHWS) |
|
|
| Duration |
August 4 – August 10 |
| Peak intensity |
120 km/h (75 mph) (10-min) 975 hPa (mbar) |
| Tropical storm (JMA) |
| Tropical depression (SSHWS) |
|
|
| Duration |
August 6 – August 9 |
| Peak intensity |
65 km/h (40 mph) (10-min) 990 hPa (mbar) |
| Typhoon (JMA) |
| Category 5 super typhoon (SSHWS) |
|
|
| Duration |
August 12 – August 20 |
| Peak intensity |
205 km/h (125 mph) (10-min) 910 hPa (mbar) |
The 2007 Pacific typhoon season was a below average season which featured 24 named storms and 14 typhoons, compared to the average of 27 and 17 respectively. had no official bounds; it ran year-round in 2007, but most tropical cyclones tend to form in the northwestern Pacific Ocean between May and November. These dates conventionally delimit the period of each year when most tropical cyclones form in the northwestern Pacific Ocean.
The scope of this article is limited to the Pacific Ocean, north of the equator and west of the international date line. Storms that form east of the date line and north of the equator are called hurricanes; see 2007 Pacific hurricane season. Tropical Storms formed in the entire West Pacific basin are assigned a name by the Japan Meteorological Agency (JMA). Tropical depressions in this basin have the "W" suffix added to their Joint Typhoon Warning Center identifier. In addition, the Philippine Atmospheric, Geophysical and Astronomical Services Administration (PAGASA) assigns names to tropical cyclones (including tropical depressions) that enter or form in the Philippine area of responsibility. These names, however, are not in common use outside of the Philippines. This can also result in the same storm having two names.
According to PAGASA, the Philippines had its second quietest season with 14 named storms since the 1998 season, with the 2010 being the most quiet season.
Since the 2000 typhoon season, the Laboratory for Atmospheric Research (LAR), of the City University of Hong Kong have issued forecasts of activity for each upcoming typhoon season. Forecasts were released in April and June predicting how many tropical cyclones, tropical storms, and typhoons there will be during the season. During the season, the LAR is predicting a below average season with fewer than usual tropical cyclones. In its April forecast, the LAR predicted that 28 tropical cyclones, 25 tropical storms, and 14 typhoons before in its June forecast predicting 27 tropical cyclones, 24 tropical storms and 14 typhoons.
...
Wikipedia


